

Liste des articles

Vue 42 fois
11 octobre 2017
Part des revenus du capital dans le revenu national : où en sommes-nous ?
Publié par
Jacques Friggit
| Immobilier
Par Jacques Friggit*
Latest data from French national accounts suggest that since 1996, the share of households’ housing capital income in national income has not been increasing anymore, and that since 2007 the share of total capital income has been decreasing, thus reversing one of T. Piketty’s main results exposed in "Capital in the Twenty-First Century".
In “Capital in the Twenty-First Century” [1] , T. Piketty points that, based on national accounts, households’ amount of capital and income from capital, relative to national income, have been decreasing from 1914, then increasing from the 1950’s, and are now close to their early twentieth century level.
Insee, the French national institute of statistics, revises national accounts every five years. We thus have series in « basis 2000 », « basis 2005 » and, since 2014, in « basis 2010 ». T. Piketty used national accounts at 2008[2] in basis 2000. Here we just update his results using national accounts at 2014 in bases 2005 and 2010[3].
Instead, after update (chart 1), it appears stable from 1996, around 7.6%, its early twentieth century level[5].
[caption id="attachment_2574" align="aligncenter" width="680"]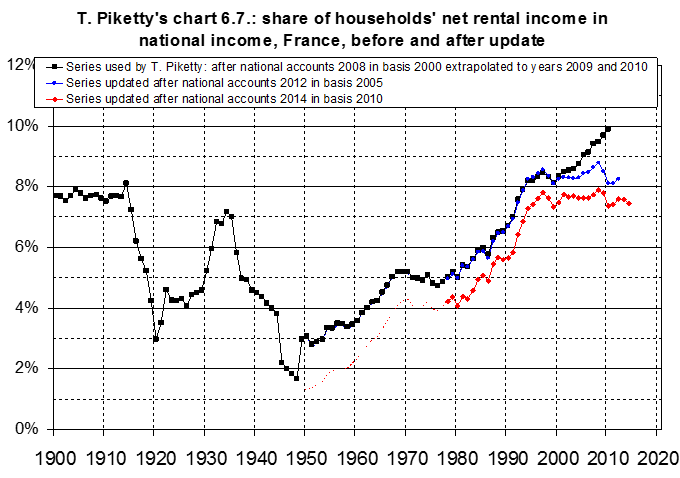 Chart 1 : update of chart 6.7. of « Capital in the Twenty-First Century »
Detailed calculations : http://www.cgedd.developpement-durable.gouv.fr/IMG/xls/piketty-actu-6-7_cle12a5b9.xls.
The change in the shape of the curve occurred mostly when national accounts shifted from basis 2000 to basis 2005: the results of the 2006 housing survey induced Insee to revise the growth in rents[6] from 1998 to 2005[7] sharply downwards.
(In addition, when national accounts shifted from basis 2005 to basis 2010, Insee revised sharply upwards households’ consumption of housing fixed capital[8], which shifts the curve downwards, and, for years 1949-1969, the growth in households’ rents net of expenses[9], which increases the slope of the curve prior to 1969. These two revisions erase, or rather invert slightly,[10] the ratio’s jump from year 1948 to year 1949 visible on T. Piketty’s chart 6.7.)
These results remain to be confirmed based on the next issues of the national accounts.
Subject thereto, the stabilization observed from 1996 signals a break from the brisk growth of years 1948-1996. The ratio might have recovered a sort of “equilibrium level” after the disturbances[11] caused by the two world wars and their consequences.
This update barely impacts the shape of the curves before 2009, with the exception of households’ net rental income, sharply revised by the National Institute of Statistics.
Nevertheless, it shows that from 2008, year of the latest financial crisis, the share of capital income in national income has been decreasing significantly, from 26% in 2007 to 22% in 2009 and 20% in 2014. This is caused mostly by a fall in the share of corporate profits, from 12% in 2007 to 8% in 2014. Meanwhile, the share of salaries paid by corporations increased, from 48% in 2007 to 52% in 2014.
[caption id="attachment_2575" align="aligncenter" width="680"]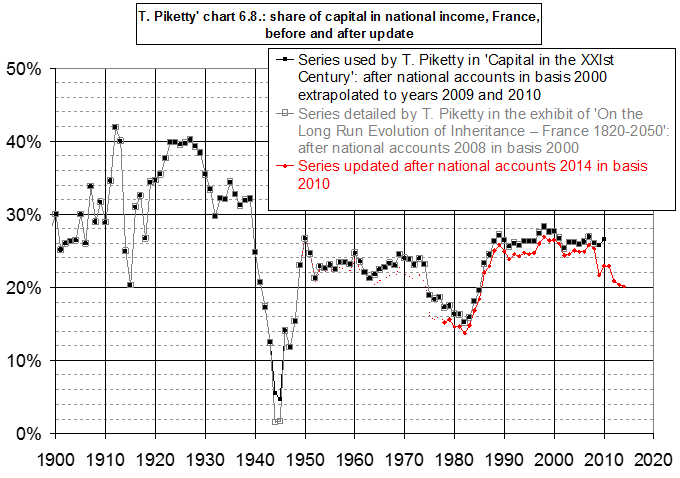 Chart 2 : update of chart 6.8. of « Capital in the Twenty-First Century »
[caption id="attachment_2576" align="aligncenter" width="1087"]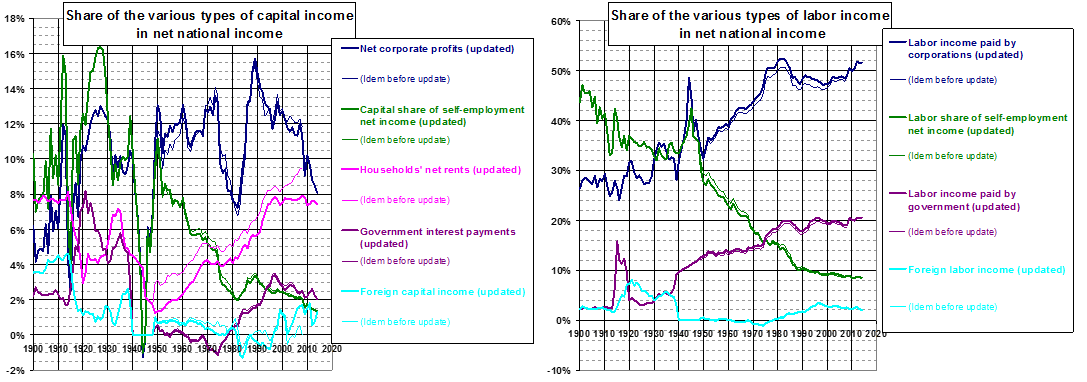 Charts 3 : share of the various types of capital income and labor income in national income in France
Detailed calculations : http://www.cgedd.developpement-durable.gouv.fr/IMG/xls/piketty-actu-6-8_cle19d19a.xls
These results, as the previous ones, remain to be confirmed based on the next issues of the national accounts.
Piketty shows that since capital ownership is more unequally distributed among households than income, a growth higher in capital income than in labor income increases total income inequality.
Conversely, it seems that since 2008, since capital income has been growing at a slower pace than labor income, the same mechanism has tended to reduce total income inequality. Of course, this does not preclude a higher inequality of total income, since labor income inequality may have increased in the meantime.*
It would be interesting if similar charts of « Capital in the Twenty-First Century » could be updated for other countries. A priority might be the case of Britain, since in 2016 it revised sharply downwards the growth in imputed rents in its national accounts[12], which should impact the share of households’ property capital income, as well as of capital and labor in general, in national income. ENSAE’s students and alumni have an ideal profile to perform this task.
* J. Friggit works with CGEDD, the internal audit and prospective department of French ministries in charge, among others fields, of housing. Nevertheless, the analyses and points of view expressed are the author’s and, in particular, not necessarily CGEDD’s or the government’s. A slightly previous version of this paper may be downloaded at http://www.cgedd.developpement-durable.gouv.fr/IMG/pdf/piketty-update_cle512cbf.pdf (in English) and http://www.cgedd.developpement-durable.gouv.fr/IMG/pdf/piketty-actu_cle7d6f51.pdf (in French). Other papers by J. Friggit about home prices in the long run are posted at http://www.cgedd.developpement-durable.gouv.fr/house-prices-in-france-property-price-index-french-a1117.html (in English) and http://www.cgedd.developpement-durable.gouv.fr/prix-immobilier-evolution-a-long-terme-a1048.html (in French).
[1] Editions du Seuil, 2013.
[2] He calculated the 2009 and 2010 values shown on the charts by extrapolation. In chart 6.7, he added 0.2% to the value of the preceding year, which was equivalent to assuming that the growth in the ratio observed on the 1980-2008 period was continuing at the same pace in 2009 and 2010. In chart 6.8., he calculated the 2009 value by sustracting 0,3% to the 2008 value, then he calculated the 2010 value by adding 0,6% to the 2009 value, which amounted to assume that the ratio was approximately constant from 2008.
[3] National accounts published by Insee do not supply households’ consumption of housing fixed capital prior to 1979, nor do they supply the total national consumption of fixed capital prior to 1978. Both aggregates are necessary to calculate the ratio shown on the chart. We estimated them (therefore the dotted line on the chart) using a method similar to T. Piketty’s :
- we estimated households’ consumption of housing fixed capital prior to 1979 by assuming, as in T. Piketty’s data files, that it is equal to the same proportion of households’ rents net of expenses as in 1979 ;
- we estimated the total national consumption of fixed capital prior to 1978 by assuming that it is equal, as a % of gross national income, to the same proportion of the value found in T. Piketty’s data files as in 1978.
The formulas used can be found in the file which contains the detailed calculations. The results are mere approximations, but should impact little the general pattern of the curve, as pointed by T. Piketty ("Capital depreciation estimates are notoriously fragile, and some of the short-run variations [...] might partly be due to measurement limitations [...]. Given that we are mostly interested in long run evolutions, we feel that these data limitations are not really relevant for our purposes", page 10 of "On the Long-Run Evolution of Inheritance : France 1820-2050, Data Appendix, Part 1, September 3rd, 2010").
[4] i.e. of households’ (imputed as well as effective, see note 7) rental income net of expenses and depreciation
[5] It has no reason to be exactly the same :
- the method used to calculate it is probably not totally identical for the early twentieth century and for the recent period ; the huge revisions caused by mere changes in the basis of the national accounts attest to the sensitivity of the result to the method used ;
- the proportion of the housing stock which is owned by households may have changed (development of social housing, disvestment by private firms).
[6] Effective rents (paid by tenants) plus imputed rents (which owner-occupiers would pay if they were tenants in the same dwelling). Computing imputed rents requires rich databases and complex calculations.
[7] The consequences of the insufficient knowledge of rents by the French government far exceed the chart we consider here, and their cost amounts to much more than the few million euros which might remedy it ; this attests to inefficiencies in public spending. For instance, since effective and imputed rents constitute 11% of gross domestic product (GDP), their revision downwards reduced economic growth, as measured by the change in GDP, by 0.1 point per year from 1998 to 2005, and reduced the level of GDP by 13 billion euros, say 0.6%, for year 2009 (see « report on the organization of the statistical service in the field of housing », IGInsee & CGEDD, June 2014, § 1.4.3. B. page 32, http://cgedd.documentation.developpement-durable.gouv.fr/document.xsp?id=Cgpc-CGEOUV00217833). As well, the data about rent increases used during the recent public debate about rent controls were highly debatable (see § 1.3.1. page 26 of the same report).
[8] By 53% to 89% depending on the year. The reason pointed by Insee is that, in conformity with new international standards, transaction costs (stamp duty, notary’s fee, estate agent’s fee, etc.) are now depreciated over the duration of ownership instead of the whole life of the property.
[9] Their level in 1949 was reduced by half. This revision corrected an inconsistency present in national accounts in bases 2000 and 2005 : in the 1950’s and 1960’s, households’ gross operating income was abnormally high compared to their production of housing services, and was even higher than the latter the 1950’s.
[10] Subject to the caveat that the method used to calculate the ratio depends on the year considered, as mentioned above; in particular, it is different for years 1948 and 1949.
[11] Disturbances channelled mostly, as far as housing in France is concerned, by rent controls implemented from 1914 in a context of high consumer price inflation, then exited from 1948.
[12] https://www.ons.gov.uk/economy/nationalaccounts/uksectoraccounts/articles/changestonationalaccounts/imputedrental.
Latest data from French national accounts suggest that since 1996, the share of households’ housing capital income in national income has not been increasing anymore, and that since 2007 the share of total capital income has been decreasing, thus reversing one of T. Piketty’s main results exposed in "Capital in the Twenty-First Century".
In “Capital in the Twenty-First Century” [1] , T. Piketty points that, based on national accounts, households’ amount of capital and income from capital, relative to national income, have been decreasing from 1914, then increasing from the 1950’s, and are now close to their early twentieth century level.
Insee, the French national institute of statistics, revises national accounts every five years. We thus have series in « basis 2000 », « basis 2005 » and, since 2014, in « basis 2010 ». T. Piketty used national accounts at 2008[2] in basis 2000. Here we just update his results using national accounts at 2014 in bases 2005 and 2010[3].
The share of households’ property capital income in national income has been constant in France since 1996
We update here chart 6.7. of « Capital in the Twenty-First Century ». It shows the share of households’ property capital income[4] in national income in France since 1900. On the original chart it appears to have been going on growing in the 1990’s and 2000’s.Instead, after update (chart 1), it appears stable from 1996, around 7.6%, its early twentieth century level[5].
[caption id="attachment_2574" align="aligncenter" width="680"]
Chart 1 : update of chart 6.7. of « Capital in the Twenty-First Century »
Detailed calculations : http://www.cgedd.developpement-durable.gouv.fr/IMG/xls/piketty-actu-6-7_cle12a5b9.xls.
The change in the shape of the curve occurred mostly when national accounts shifted from basis 2000 to basis 2005: the results of the 2006 housing survey induced Insee to revise the growth in rents[6] from 1998 to 2005[7] sharply downwards.
(In addition, when national accounts shifted from basis 2005 to basis 2010, Insee revised sharply upwards households’ consumption of housing fixed capital[8], which shifts the curve downwards, and, for years 1949-1969, the growth in households’ rents net of expenses[9], which increases the slope of the curve prior to 1969. These two revisions erase, or rather invert slightly,[10] the ratio’s jump from year 1948 to year 1949 visible on T. Piketty’s chart 6.7.)
These results remain to be confirmed based on the next issues of the national accounts.
Subject thereto, the stabilization observed from 1996 signals a break from the brisk growth of years 1948-1996. The ratio might have recovered a sort of “equilibrium level” after the disturbances[11] caused by the two world wars and their consequences.
The share of capital income in national income has been decreasing since 2007
We now update chart 6.8. of the same work (chart 2). It shows the share of total capital income in national income. We also update the shares of the various types of capital income and labor income in national income (charts 3).This update barely impacts the shape of the curves before 2009, with the exception of households’ net rental income, sharply revised by the National Institute of Statistics.
Nevertheless, it shows that from 2008, year of the latest financial crisis, the share of capital income in national income has been decreasing significantly, from 26% in 2007 to 22% in 2009 and 20% in 2014. This is caused mostly by a fall in the share of corporate profits, from 12% in 2007 to 8% in 2014. Meanwhile, the share of salaries paid by corporations increased, from 48% in 2007 to 52% in 2014.
[caption id="attachment_2575" align="aligncenter" width="680"]
Chart 2 : update of chart 6.8. of « Capital in the Twenty-First Century »
[caption id="attachment_2576" align="aligncenter" width="1087"]
Charts 3 : share of the various types of capital income and labor income in national income in France
Detailed calculations : http://www.cgedd.developpement-durable.gouv.fr/IMG/xls/piketty-actu-6-8_cle19d19a.xls
These results, as the previous ones, remain to be confirmed based on the next issues of the national accounts.
Piketty shows that since capital ownership is more unequally distributed among households than income, a growth higher in capital income than in labor income increases total income inequality.
Conversely, it seems that since 2008, since capital income has been growing at a slower pace than labor income, the same mechanism has tended to reduce total income inequality. Of course, this does not preclude a higher inequality of total income, since labor income inequality may have increased in the meantime.*
As a conclusion
This update illustrates how deeply very technical or apparently innocuous property aggregates may impact national accounts, and how fragile our knowledge of some of them is.It would be interesting if similar charts of « Capital in the Twenty-First Century » could be updated for other countries. A priority might be the case of Britain, since in 2016 it revised sharply downwards the growth in imputed rents in its national accounts[12], which should impact the share of households’ property capital income, as well as of capital and labor in general, in national income. ENSAE’s students and alumni have an ideal profile to perform this task.
* J. Friggit works with CGEDD, the internal audit and prospective department of French ministries in charge, among others fields, of housing. Nevertheless, the analyses and points of view expressed are the author’s and, in particular, not necessarily CGEDD’s or the government’s. A slightly previous version of this paper may be downloaded at http://www.cgedd.developpement-durable.gouv.fr/IMG/pdf/piketty-update_cle512cbf.pdf (in English) and http://www.cgedd.developpement-durable.gouv.fr/IMG/pdf/piketty-actu_cle7d6f51.pdf (in French). Other papers by J. Friggit about home prices in the long run are posted at http://www.cgedd.developpement-durable.gouv.fr/house-prices-in-france-property-price-index-french-a1117.html (in English) and http://www.cgedd.developpement-durable.gouv.fr/prix-immobilier-evolution-a-long-terme-a1048.html (in French).
[1] Editions du Seuil, 2013.
[2] He calculated the 2009 and 2010 values shown on the charts by extrapolation. In chart 6.7, he added 0.2% to the value of the preceding year, which was equivalent to assuming that the growth in the ratio observed on the 1980-2008 period was continuing at the same pace in 2009 and 2010. In chart 6.8., he calculated the 2009 value by sustracting 0,3% to the 2008 value, then he calculated the 2010 value by adding 0,6% to the 2009 value, which amounted to assume that the ratio was approximately constant from 2008.
[3] National accounts published by Insee do not supply households’ consumption of housing fixed capital prior to 1979, nor do they supply the total national consumption of fixed capital prior to 1978. Both aggregates are necessary to calculate the ratio shown on the chart. We estimated them (therefore the dotted line on the chart) using a method similar to T. Piketty’s :
- we estimated households’ consumption of housing fixed capital prior to 1979 by assuming, as in T. Piketty’s data files, that it is equal to the same proportion of households’ rents net of expenses as in 1979 ;
- we estimated the total national consumption of fixed capital prior to 1978 by assuming that it is equal, as a % of gross national income, to the same proportion of the value found in T. Piketty’s data files as in 1978.
The formulas used can be found in the file which contains the detailed calculations. The results are mere approximations, but should impact little the general pattern of the curve, as pointed by T. Piketty ("Capital depreciation estimates are notoriously fragile, and some of the short-run variations [...] might partly be due to measurement limitations [...]. Given that we are mostly interested in long run evolutions, we feel that these data limitations are not really relevant for our purposes", page 10 of "On the Long-Run Evolution of Inheritance : France 1820-2050, Data Appendix, Part 1, September 3rd, 2010").
[4] i.e. of households’ (imputed as well as effective, see note 7) rental income net of expenses and depreciation
[5] It has no reason to be exactly the same :
- the method used to calculate it is probably not totally identical for the early twentieth century and for the recent period ; the huge revisions caused by mere changes in the basis of the national accounts attest to the sensitivity of the result to the method used ;
- the proportion of the housing stock which is owned by households may have changed (development of social housing, disvestment by private firms).
[6] Effective rents (paid by tenants) plus imputed rents (which owner-occupiers would pay if they were tenants in the same dwelling). Computing imputed rents requires rich databases and complex calculations.
[7] The consequences of the insufficient knowledge of rents by the French government far exceed the chart we consider here, and their cost amounts to much more than the few million euros which might remedy it ; this attests to inefficiencies in public spending. For instance, since effective and imputed rents constitute 11% of gross domestic product (GDP), their revision downwards reduced economic growth, as measured by the change in GDP, by 0.1 point per year from 1998 to 2005, and reduced the level of GDP by 13 billion euros, say 0.6%, for year 2009 (see « report on the organization of the statistical service in the field of housing », IGInsee & CGEDD, June 2014, § 1.4.3. B. page 32, http://cgedd.documentation.developpement-durable.gouv.fr/document.xsp?id=Cgpc-CGEOUV00217833). As well, the data about rent increases used during the recent public debate about rent controls were highly debatable (see § 1.3.1. page 26 of the same report).
[8] By 53% to 89% depending on the year. The reason pointed by Insee is that, in conformity with new international standards, transaction costs (stamp duty, notary’s fee, estate agent’s fee, etc.) are now depreciated over the duration of ownership instead of the whole life of the property.
[9] Their level in 1949 was reduced by half. This revision corrected an inconsistency present in national accounts in bases 2000 and 2005 : in the 1950’s and 1960’s, households’ gross operating income was abnormally high compared to their production of housing services, and was even higher than the latter the 1950’s.
[10] Subject to the caveat that the method used to calculate the ratio depends on the year considered, as mentioned above; in particular, it is different for years 1948 and 1949.
[11] Disturbances channelled mostly, as far as housing in France is concerned, by rent controls implemented from 1914 in a context of high consumer price inflation, then exited from 1948.
[12] https://www.ons.gov.uk/economy/nationalaccounts/uksectoraccounts/articles/changestonationalaccounts/imputedrental.
Auteur

Articles liés
-
- Le grand remplacement : mythe ou réalité ?Immobilier - Le grand remplacement : mythe ou réalité ? Lire la suite >
-
- L'enfance des inégalités... et comment l'enrayerImmobilier - L'enfance des inégalités... et comment... Lire la suite >
-
- Cryptomonnaies [1], consensus distribué et blockchainImmobilier - Cryptomonnaies [1], consensus distribué et... Lire la suite >
-
-
- L'environnement institutionnel et les liens entre les flux de capitaux et la fuite des capitaux en Afrique : cas du CamerounImmobilier - L'environnement institutionnel et les liens... Lire la suite >
-
-
- Recherche Economique et Stratégique : La compétitivité françaiseImmobilier - Recherche Economique et Stratégique : La... Lire la suite >
-
- Médias et audience en Afrique : un secteur d’avenirImmobilier - Médias et audience en Afrique : un secteur... Lire la suite >
-
- Le Nouveau Cycle du Capital Investissement AfricainImmobilier - Le Nouveau Cycle du Capital Investissement... Lire la suite >
-
- What if Sociologists Had as Much Influence as Economists?Immobilier - What if Sociologists Had as Much Influence as... Lire la suite >
-
- La révolution quaternaire, un challenge pour les entreprises face aux GAFAImmobilier - La révolution quaternaire, un challenge pour... Lire la suite >


Aucun commentaire
Vous devez être connecté pour laisser un commentaire. Connectez-vous.